Calculating a Confidence Interval
This chapter draws on material from:
- ModernDive by Chester Ismay and Albert Y. Kim, licensed under CC BY-NC-SA 4.0
Changes to the source material include removal of original material, the addition of new material, combining of sources, and editing of original material for a different audience.
Introduction
In last week's walkthrough, we considered sampling. We took a population of 50 U.S. states and calculated the mean of sampled states as a way of estimating the actual mean of all 50 states. Because we selected states randomly, different samples yielded different means and hence different estimates of the actual population mean.
Later on in the walkthrough, we mimicked the above sampling procedure a large number of times. For example, we repeated this sampling procedure 1000 times and visualized the means that we obtained from each of those samples.
In doing so, what we did was construct sampling distributions. The motivation for taking 1000 repeated samples and visualizing the resulting estimates was to study how these estimates varied from one sample to another; in other words, we wanted to study the effect of sampling variation. We could easily have quantified this variation by calculating the standard deviation between all of these estimated means. When we do this, we use a specific name—the standard error—for the standard deviation.
However, I also made it clear that this kind of sampling exercise is not the sort of thing that one would do in real life; this was merely an activity used to study the effects of sampling variation. In a real-life situation, we would not take 1000 samples of size n, but rather take a single representative sample that’s as large as possible. Additionally, we knew that the true mean of the 50 U.S. states, and in a real-life situation, we will not know what a population mean is—if we did, then why would we take a sample to estimate it?
As we covered in our first reading for this week, a confidence interval is one of the statistical tools at our disposal for acknowledging that we only have a sample mean but trying to draw conclusions about the unknown population mean nonetheless. In this walkthrough, we'll revisit some of these concepts by walking through them in R.
Loading Packages
As usual, let's start our walkthrough by loading the packages that we're going to need. At least one of these packages (infer) is new, so make sure to install it before running the code below!
library(tidyverse)
library(moderndive)
library(infer)
Pennies Activity
Try to imagine all the pennies being used in the United States in 2019. That’s a lot of pennies! Now say we’re interested in the average year of minting of all these pennies. One way to compute this value would be to gather up all pennies being used in the US, record the year, and compute the average. However, this would be near impossible! So instead, let’s collect a sample of 50 pennies from a local bank in downtown Northampton, Massachusetts, USA (or rather, let's use a dataset provided by someone who actually did this—I don't live in Massachusetts, and I'm not sure that any of you do, either).
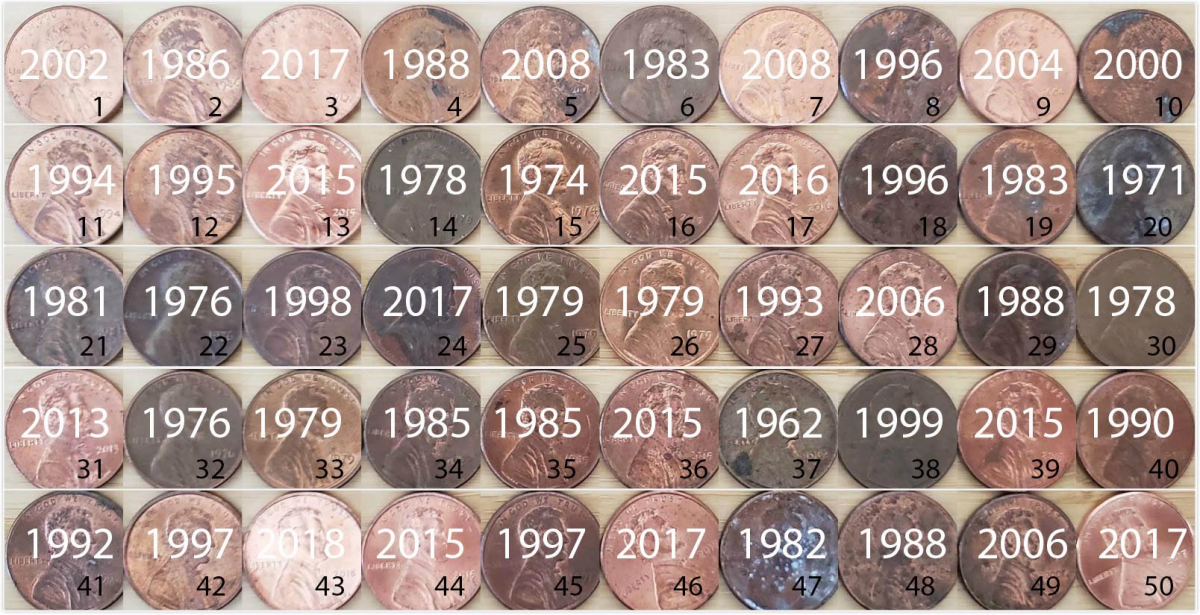
An image of these 50 pennies can be seen above. For each of the 50 pennies starting in the top left, progressing row-by-row, and ending in the bottom right, we assigned an “ID” identification variable and marked the year of minting.
Now, you don't have these 50 pennies on hand, but you can load this data—it's included as the pennies_sample data frame in the moderndive package:
pennies_sample# A tibble: 50 × 2
ID year
1 1 2002
2 2 1986
3 3 2017
4 4 1988
5 5 2008
6 6 1983
7 7 2008
8 8 1996
9 9 2004
10 10 2000
# … with 40 more rows The pennies_sample data frame has 50 rows corresponding to each penny with two variables. The first variable ID corresponds to the ID labels in the image above, whereas the second variable year corresponds to the year of minting saved as a numeric variable, also known as a double (dbl). As a quick aside, it's not always a good idea to save years as dbl-type data—sometimes you want it saved as a datatype that works better with dates and times. Here, though, dbl is just fine.
Based on these 50 sampled pennies, what can we say about all US pennies in 2019? Let’s study some properties of our sample by performing an exploratory data analysis. Let’s first visualize the distribution of the year of these 50 pennies using our data visualization tools from earlier. Since year is a numerical variable, we use a histogram to visualize its distribution:
ggplot(pennies_sample, aes(x = year)) +
geom_histogram(binwidth = 10, color = "white")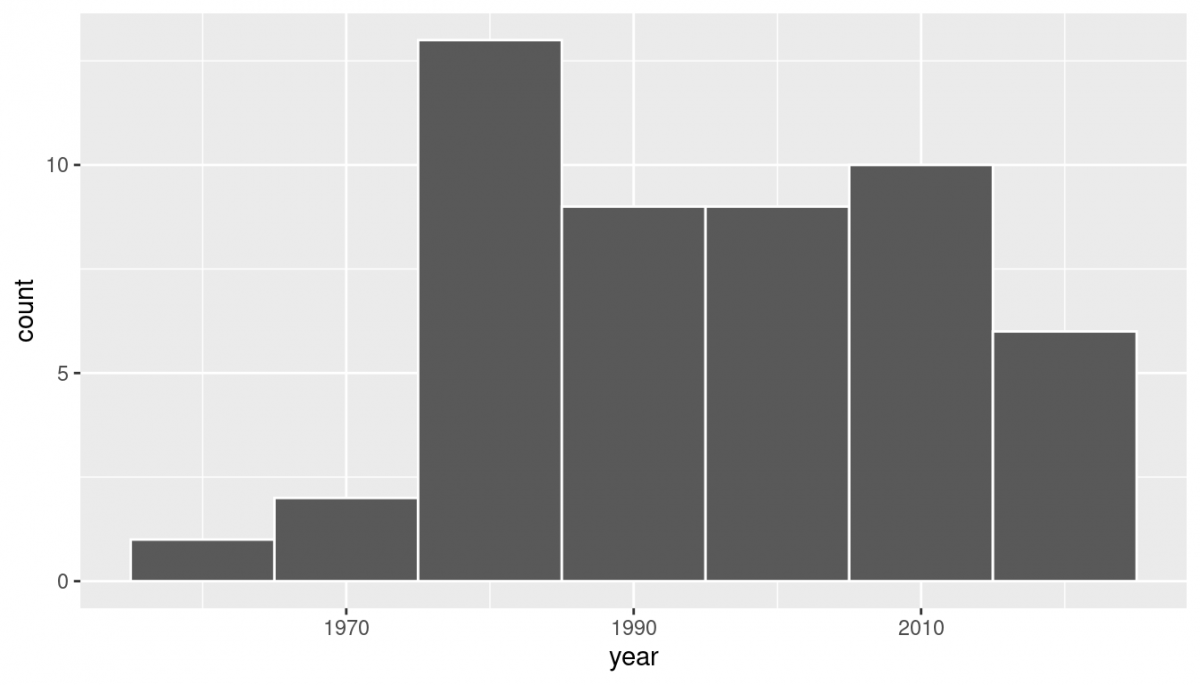 Observe a slightly left-skewed distribution, since most pennies fall between 1980 and 2010 with only a few pennies older than 1970. What is the average year for the 50 sampled pennies? Eyeballing the histogram it appears to be around 1990. Let’s now compute this value exactly using some data wrangling tools:
pennies_mean <- pennies_sample %>%
  summarize(mean_year = mean(year))
pennies_mean
# A tibble: 1 × 1
mean_year
1 1995.4 Thus, if we’re willing to assume that pennies_sample is a representative sample from all US pennies, a “good guess” of the average year of minting of all US pennies would be 1995.44. In other words, around 1995.
This should all sound pretty familiar from our previous discussion of samples and populations! Here our population is the number of pennies being used in the US, a value which we don’t know and probably never will. The population parameter of interest is now the population mean year of all these pennies. In order to estimate this population parameter, someone went to the bank and obtained a sample of 50 pennies (and then provided it to us through moderndive). Then, we computed the relevant point estimate: the sample mean year of these 50 pennies. This point estimate is 1995.44 and serves as an estimate of the population mean year of all US pennies.
Recall that this kind of estimate is prone to sampling variation. For example, in this particular sample, we observed three pennies with the year 1999. If we sampled another 50 pennies, would we observe exactly three pennies with the year 1999 again? More than likely not. We might observe none, one, two, or maybe even all 50! The same can be said for the other 26 unique years that are represented in our sample of 50 pennies.
To study the effects of sampling variation, we could easily go back to the bank and grab another roll of 50 pennies. However, remember that last week, we were able to look at the effects of sampling variation with a single data set—that is, we repeatedly sampled our data set of 50 states to show how those samples varied from each other. Since we only had 50 states to work with, that was really the only option that we had last week. However, if we were feeling too lazy to go back to the bank, we could use the same technique—called bootstrap resampling with replacement—to take another look at sampling variation.
Let's take a look!
Bootstrap Resampling with Replacement
Let's walk through this technique in two steps. First, we're going to resample from our original sample—that is, we'll use our first sample to generate a second sample. Second, we'll do repeated resampling in the same way. As we walk through this, you ought to see some similarities to last week's walkthrough!
Resampling with Replacement
Recall that the pennies_sample data frame included in the moderndive package contains the years of our original sample of 50 pennies from the bank. Furthermore, recall from last week that we used the rep_sample_n() function to obtain samples from our population of U.S. states.
Using these resources, we can do a resampling with replacement of our original sample 50 pennies:
resample <- pennies_sample %>%
  rep_sample_n(size = 50, replace = TRUE)
Observe that the size argument is set to match the original sample size of 50 pennies. Observe also how we explicitly set the replace argument to TRUE in order to tell rep_sample_n() that we would like to sample pennies with replacement. When we resample with replacement, an item can be sampled multiple times. That is, even though we're drawing a 50 item sample from a group of 50 items, we won't necessarily draw each item once. Instead, there's simply a 1/50 chance that each item will be drawn, and that doesn't preclude drawing the penny with ID value 1 more than once.
Had we not set replace = TRUE, the function would’ve assumed the default value of FALSE and hence done resampling without replacement (like we did last week). Additionally, since we didn’t specify the number of replicates via the reps argument, the function assumes the default of one replicate reps = 1.
Let’s look at the first 10 out of 50 rows of virtual_resample. Keep in mind that the sampling process is random—your output will likely look different than mine! However, I'm still going to display my output to walk you through interpreting it:
resample# A tibble: 50 × 3
# Groups: replicate [1]
replicate ID year
1 1 37 1962
2 1 1 2002
3 1 45 1997
4 1 28 2006
5 1 50 2017
6 1 10 2000
7 1 16 2015
8 1 47 1982
9 1 23 1998
10 1 44 2015
# … with 40 more row The replicate variable only takes on the value of 1 corresponding to us only having reps = 1, the ID variable indicates which of the 50 pennies from pennies_sample was resampled, and year denotes the year of minting. Let’s now compute the mean year in our virtual resample of size 50 using data wrangling functions included in the dplyr package:
resample %>%
  summarize(resample_mean = mean(year))
# A tibble: 1 × 2
replicate resample_mean
1 1 1996 Unsurprisingly, based on everything we've covered so far, the resulting mean year is different than the mean year of our 50 originally sampled pennies of 1995.44. Likewise, the mean year in your output is likely to be different from either 1995.44 or this new mean that I've come across!
Multiple Resamples
Let’s now do this same process, but repeat it 35 times. Using these results, we’ll be able to study the variability in the sample means from 35 resamples of size 50. Let’s first add a reps = 35 argument to rep_sample_n() to indicate we would like 35 replicates. Thus, we want to repeat the resampling with the replacement of 50 pennies 35 times.
resamples <- pennies_sample %>%
  rep_sample_n(size = 50, replace = TRUE, reps = 35)
resamples
# A tibble: 1,750 × 3
# Groups: replicate [35]
replicate ID year
1 1 21 1981
2 1 34 1985
3 1 4 1988
4 1 11 1994
5 1 26 1979
6 1 8 1996
7 1 19 1983
8 1 21 1981
9 1 49 2006
10 1 2 1986
# … with 1,740 more rows The resulting virtual_resamples data frame has 35 * 50 = 1750 rows corresponding to 35 resamples of 50 pennies. Let’s now compute the resulting 35 sample means using the same dplyr code as we did in the previous section, but this time adding a group_by(replicate). As we do, remember that sampling is random—even if you use the same code, you should get different results.
resampled_means <- resamples %>%
  group_by(replicate) %>%
  summarize(mean_year = mean(year))
resampled_means
# A tibble: 35 × 2
replicate mean_year
1 1 1995.58
2 2 1999.74
3 3 1993.7
4 4 1997.1
5 5 1999.42
6 6 1995.12
7 7 1994.94
8 8 1997.78
9 9 1991.26
10 10 1996.88
# … with 25 more rows Observe that resampled_means has 35 rows, corresponding to the 35 resampled means. Furthermore, observe that the values of mean_year vary—just like last week! In fact, let's go ahead and visualize this variation using a histogram:
ggplot(resampled_means, aes(x = mean_year)) +
  geom_histogram(binwidth = 1, color = "white", boundary = 1990) +
  labs(x = "Resample mean year")
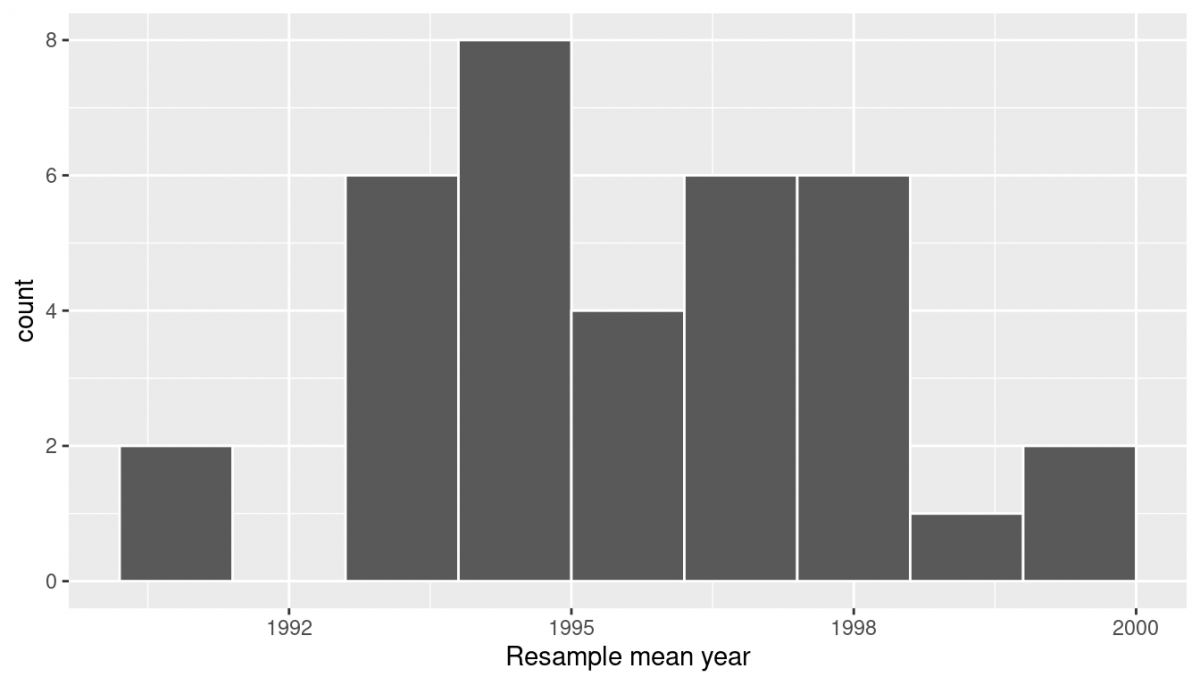
In the “resampling with replacement” scenario we are illustrating here, both of these histograms have a special name: the bootstrap distribution of the sample mean. They are an approximation to the sampling distribution of the sample mean, as covered in our first reading for this week. These distributions allow us to study the effect of sampling variation on our estimates of the true population mean, in this case the true mean year for all US pennies. However, like we emphasized last week, multiple resampling isn't how we do things in practice—in fact, we typically don't even take multiple samples, like we've been talking about doing by going back to the bank for more rolls of pennies. Instead, all of this is working through the concepts that we've been reading through so that we can lay the groundwork for confidence intervals (and future concepts).
Before we do that, one more step, though!
Full-On Bootstrapping Resampling
One of the goals of resampling with replacement is to construct the bootstrap distribution, which is an approximation of the sampling distribution. However, the bootstrap distribution from above is based only on 35 resamples and hence looks a little coarse. Let’s increase the number of resamples to 1000, so that we can hopefully better see the shape and the variability between different resamples.
# Repeat resampling 1000 times
resamples <- pennies_sample %>%
  rep_sample_n(size = 50, replace = TRUE, reps = 1000)

# Compute 1000 sample means
resampled_means <- resamples %>%
  group_by(replicate) %>%
  summarize(mean_year = mean(year))
Going forward, let’s combine these two operations into a single chain of pipe (%>%) operators:
resampled_means <- pennies_sample %>%
  rep_sample_n(size = 50, replace = TRUE, reps = 1000) %>%
  group_by(replicate) %>%
  summarize(mean_year = mean(year))
resampled_means
# A tibble: 1,000 × 2
replicate mean_year
1 1 1992.6
2 2 1994.78
3 3 1994.74
4 4 1997.88
5 5 1990
6 6 1999.48
7 7 1990.26
8 8 1993.2
9 9 1994.88
10 10 1996.3
# … with 990 more rows Now, let’s visualize the bootstrap distribution of these 1000 means based on 1000 virtual resamples. Keep in mind that your visualization will look different than mine!
ggplot(resampled_means, aes(x = mean_year)) +
geom_histogram(binwidth = 1, color = "white", boundary = 1990) +
labs(x = "sample mean")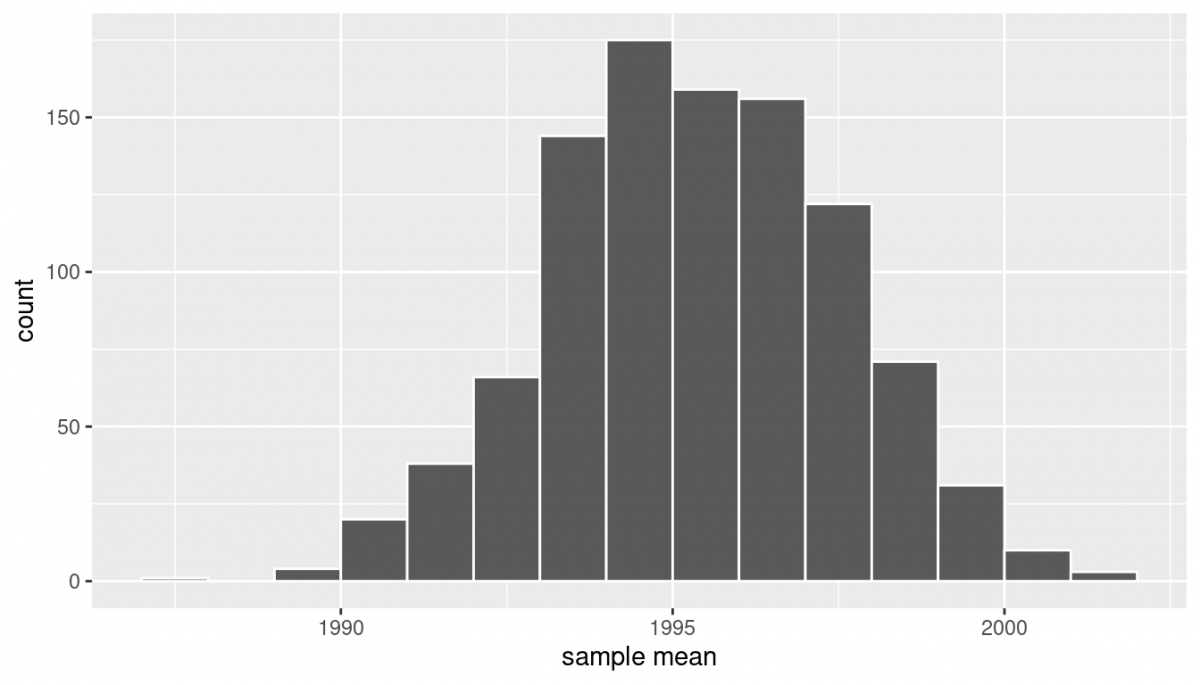 Note here that the bell shape is starting to become much more apparent. We now have a general sense for the range of values that the sample mean may take on. But where is this histogram centered? Let’s compute the mean of the 1000 resample means:
resampled_means %>%
  summarize(mean_of_means = mean(mean_year))
# A tibble: 1 × 1
mean_of_means
1 1995.36 The mean of my 1000 means is 1995.36, which is quite close to the mean of our original sample of 50 pennies of 1995.44. This is the case since each of the 1000 resamples is based on the original sample of 50 pennies.
Congratulations! You’ve just constructed your first bootstrap distribution! In the next section, you’ll see how to use this bootstrap distribution to construct confidence intervals.
Confidence Intervals
Let’s start this section with an analogy involving fishing. Say you are trying to catch a fish. On the one hand, you could use a spear, while on the other you could use a net. Using the net will probably allow you to catch more fish!
Now think back to our pennies exercise where you are trying to estimate the true population mean year of all US pennies. Think of the this population mean as a fish. On the one hand, we could use the appropriate point estimate/sample statistic to estimate the population mean. Based on our sample of 50 pennies from the bank, the sample mean was 1995.44. Think of using this value as “fishing with a spear.”
What would “fishing with a net” correspond to? Look at the bootstrap distribution we just visualized once more. Between which two years would you say that “most” sample means lie? While this question is somewhat subjective, saying that most sample means lie between 1992 and 2000 would not be unreasonable. Think of this interval as the “net.”
What we’ve just illustrated is the concept of a confidence interval, which we’ll abbreviate with “CI” throughout this walkthrough. As opposed to a point estimate/sample statistic that estimates the value of an unknown population parameter with a single value, a confidence interval gives what can be interpreted as a range of plausible values. Going back to our analogy, point estimates/sample statistics can be thought of as spears, whereas confidence intervals can be thought of as nets.
Our proposed interval of 1992 to 2000 was constructed by eye and was thus somewhat subjective. We now introduce two methods for constructing such intervals in a more exact fashion: the percentile method and the standard error method.
oth methods for confidence interval construction share some commonalities. First, they are both constructed from a bootstrap distribution. Second, they both require you to specify the confidence level. Commonly used confidence levels include 90%, 95%, and 99%. All other things being equal, higher confidence levels correspond to wider confidence intervals, and lower confidence levels correspond to narrower confidence intervals. In this book, we’ll be mostly using 95% and hence constructing “95% confidence intervals for the population mean" in this walkthrough.
Percentile Method
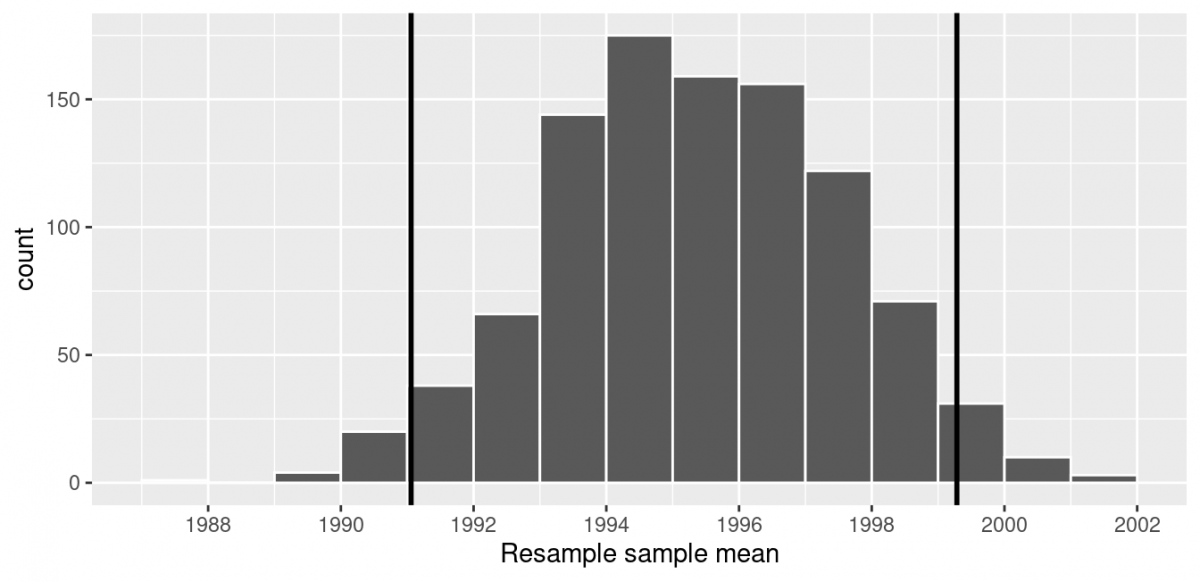
One method to construct a confidence interval is to use the middle 95% of values of the bootstrap distribution. We can do this by computing the 2.5th and 97.5th percentiles, which are 1991.059 and 1999.283, respectively. This is known as the percentile method for constructing confidence intervals.
For now, let’s focus only on the concepts behind a percentile method constructed confidence interval; we’ll show you the code that computes these values in the next section.
Let’s use vertical lines to mark these percentiles on the bootstrap distribution I visualized earlier. About 95% of the mean_year variable values in resampled_means fall between 1991.059 and 1999.283, with 2.5% to the left of the leftmost line and 2.5% to the right of the rightmost line.
Standard Error Method
Recall from earlier that if a numerical variable follows a normal distribution (or, in other words, the histogram of this variable is bell-shaped), roughly 95% of values fall within 2 standard deviations of the mean. If we want to be more accurate, we ought to say that 95% of values fall within 1.95 standard deviations of the mean (in either direction!). Given that our bootstrap distribution from earlier is normally shaped, let’s use this fact about normal distributions to construct a confidence interval in a different way.
First, recall that my bootstrap distribution has a mean equal to 1995.36. This value almost coincides exactly with the value of the sample mean of our original 50 pennies of 1995.44. Second, let’s compute the standard deviation of the bootstrap distribution using the values of mean_year in the resampled_means data frame:
resampled_means %>%
  summarize(SE = sd(mean_year))
# A tibble: 1 × 1
SE
1 2.15466 What is this value? Recall that the bootstrap distribution is an approximation to the sampling distribution. Recall also that the standard deviation of a sampling distribution has a special name: the standard error. Putting these two facts together, we can say that 2.155 is an approximation of the standard error of the sample mean.
Thus, using our 95% rule of thumb about normal distributions, we can calculate the lower and upper endpoints of a 95% confidence interval for the pouplation mean. We take the standard error (2.15466), multiply it by 1.96 (4.2231336, rounded to 4.22), and then add it to the sample mean (1995.44 + 4.22 = 1999.66) and subtract it from the sample mean (1995.44 - 4.22 = 1991.22).
Let’s now add the SE method confidence interval with dashed lines to our visualization from earlier.
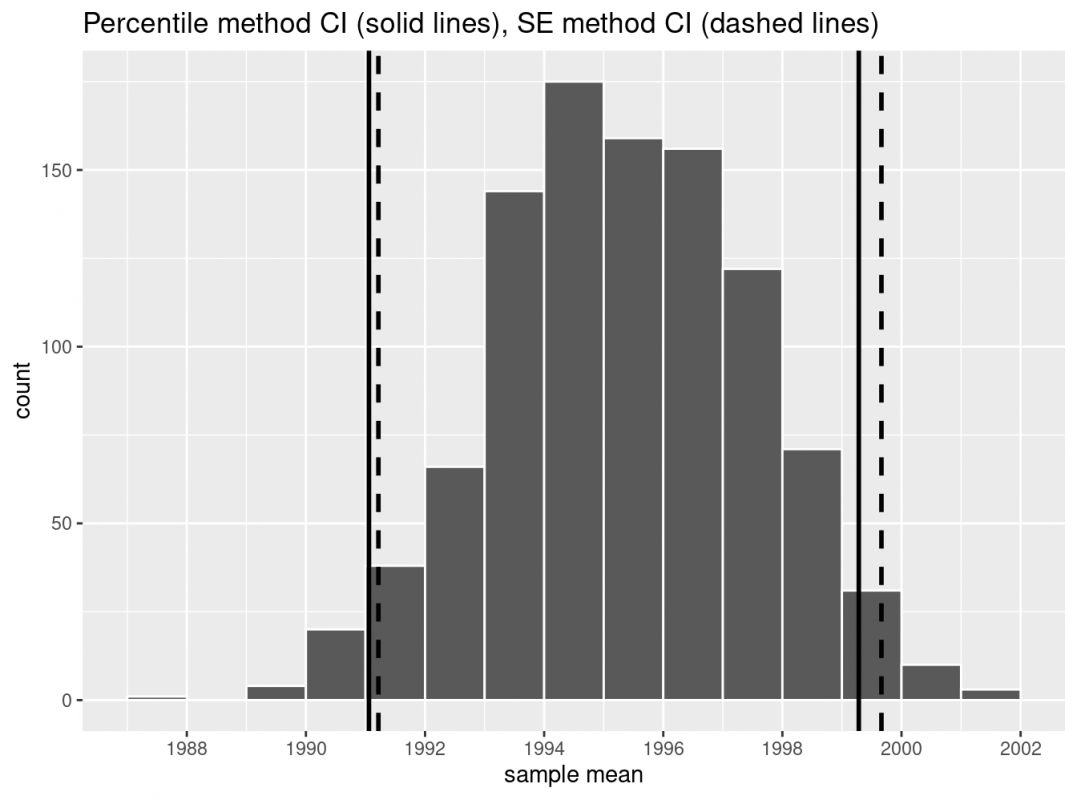 We see that both methods produce nearly identical 95% confidence intervals for the population mean, with the percentile method yielding (1991.06, 1990.28) while the standard error method produces (1991.22,1999.66). However, recall that we can only use the standard error rule when the bootstrap distribution is roughly normally shaped!
Now that we’ve introduced the concept of confidence intervals and laid out the intuition behind two methods for constructing them, let’s explore the code that allows us to construct them
Constructing Confidence Intervals
Recall that the process of resampling with replacement we performed earlier is known as bootstrapping. The term bootstrapping originates in the expression of “pulling oneself up by their bootstraps,” meaning to “succeed only by one’s own efforts or abilities.”
From a statistical perspective, bootstrapping alludes to succeeding in being able to study the effects of sampling variation on estimates from the “effort” of a single sample. Or more precisely, it refers to constructing an approximation to the sampling distribution using only one sample.
To perform this resampling with replacement earlier, we used the rep_sample_n() function, making sure that the size of the resamples matched the original sample size of 50. In this section, we’ll build off these ideas to construct confidence intervals using a new package: the infer package for “tidy” and transparent statistical inference.
Why bring in a new package? In short, while the functions we used earlier were more than capable of construction a bootstrap distribution in a simple situation, we need a bit more power to work with a more complicated situation.
Workflow for the infer Package
The infer package is an R package for statistical inference. It makes efficient use of the %>% pipe operator to spell out the sequence of steps necessary to perform statistical inference in a “tidy” and transparent fashion. Furthermore, just as the dplyr package provides functions with verb-like names to perform data wrangling, the infer package provides functions with intuitive verb-like names to perform statistical inference.
Let’s go back to our pennies. Previously, we computed the value of the sample mean using the dplyr function summarize():
pennies_sample %>%
  summarize(stat = mean(year))
We can also do this using infer functions specify() and calculate():
pennies_sample %>%
  specify(response = year) %>%
  calculate(stat = "mean")
You might be asking yourself: “Isn’t the infer code longer? Why would I use that code?”. While not immediately apparent, you’ll see that there are three chief benefits to the infer workflow as opposed to the dplyr workflow.
First, the infer verb names better align with the overall resampling framework you need to understand to construct confidence intervals and to conduct hypothesis tests.
Second, you can jump back and forth seamlessly between confidence intervals and hypothesis testing with minimal changes to your code.
Third, the infer workflow is much simpler for conducting inference when you have more than one variable.
The latter two advantages aren't relevant for what we're doing right now, but we might as well set the stage for future work!
Let’s now illustrate the sequence of verbs necessary to construct a confidence interval for the population mean year of minting of all US pennies in 2019. So that I don't have to type this several times, remember that sampling is random—you ought to see more-or-less the same things that I show in my output below, but you shouldn't expect to see identical output!
specify variables
The specify() function is used to choose which variables in a data frame will be the focus of our statistical inference. We do this by specifying the response argument. For example, in our pennies_sample data frame of the 50 pennies sampled from the bank, the variable of interest is year:
pennies_sample %>%
  specify(response = year)
Response: year (numeric)
# A tibble: 50 × 1
year
1 2002
2 1986
3 2017
4 1988
5 2008
6 1983
7 2008
8 1996
9 2004
10 2000
# … with 40 more rows Notice how the data itself doesn’t change, but the Response: year (numeric) meta-data does. This is similar to how the group_by() verb from dplyr doesn’t change the data, but only adds “grouping” meta-data, as we saw earlier in the semester.
We can also specify which variables will be the focus of our statistical inference using a formula = y ~ x. This is the same formula notation you saw in our discussion of regression models: the dependent variable y is separated from the independent variable x by a ~ (“tilde”). The following use of specify() with the formula argument yields the same result seen previously:
pennies_sample %>%
  specify(formula = year ~ NULL)
Since in the case of pennies we only have a dependent variable and no independent variable of interest, we set the x on the right-hand side of the ~ to be NULL.
While in the case of the pennies either specification works just fine, we’ll see examples later on where the formula specification is simpler.
generate replicates
After we specify() the variables of interest, we pipe the results into the generate() function to generate replicates. In other words, we repeat the resampling process a large number of times, like we did manually earlier.
The generate() function’s first argument is reps, which sets the number of replicates we would like to generate. Since we want to resample the 50 pennies in pennies_sample with replacement 1000 times, we set reps = 1000. The second argument type determines the type of computer simulation we’d like to perform. We set this to type = "bootstrap" indicating that we want to perform bootstrap resampling. You’ll see different options for type next week.
pennies_sample %>%
  specify(response = year) %>%
  generate(reps = 1000, type = "bootstrap")
Response: year (numeric)
# A tibble: 50,000 × 2
# Groups: replicate [1,000]
replicate year
1 1 1981
2 1 1988
3 1 2006
4 1 2016
5 1 2002
6 1 1985
7 1 1979
8 1 2000
9 1 2006
10 1 2016
# … with 49,990 more rows Observe that the resulting data frame has 50,000 rows. This is because we performed resampling of 50 pennies with replacement 1000 times and 50,000 = 50 1000.
The variable replicate indicates which resample each row belongs to. So it has the value 1 50 times, the value 2 50 times, all the way through to the value 1000 50 times. The default value of the type argument is "bootstrap" in this scenario, so if the last line was written as generate(reps = 1000), we’d obtain the same results.
Note that the steps of the infer workflow so far produce the same results as the original workflow using the rep_sample_n() function we saw earlier.
calculate summary statistics
After we generate() many replicates of bootstrap resampling with replacement, we next want to summarize each of the 1000 resamples of size 50 to a single sample statistic value. The calculate() function does this.
In our case, we want to calculate the mean year for each bootstrap resample of size 50. To do so, we set the stat argument to "mean". You can also set the stat argument to a variety of other common summary statistics.To see a list of all possible summary statistics you can use, type ?calculate() and read the help file.
Let’s save the result in a data frame called bootstrap_distribution and explore its contents:
bootstrap_distribution <- pennies_sample %>%
  specify(response = year) %>%
  generate(reps = 1000) %>%
  calculate(stat = "mean")
bootstrap_distribution
# A tibble: 1,000 × 2
replicate stat
1 1 1995.7
2 2 1994.04
3 3 1993.62
4 4 1994.5
5 5 1994.08
6 6 1993.6
7 7 1995.26
8 8 1996.64
9 9 1994.3
10 10 1995.94
# … with 990 more rows Observe that the resulting data frame has 1000 rows and 2 columns corresponding to the 1000 replicate values. It also has the mean year for each bootstrap resample saved in the variable stat.
You may have recognized at this point that the calculate() step in the infer workflow produces the same output as the group_by() %>% summarize() steps in the original workflow.
visualize summary statistics
The visualize() verb provides a quick way to visualize the bootstrap distribution as a histogram of the numerical stat variable’s values.
visualize(bootstrap_distribution)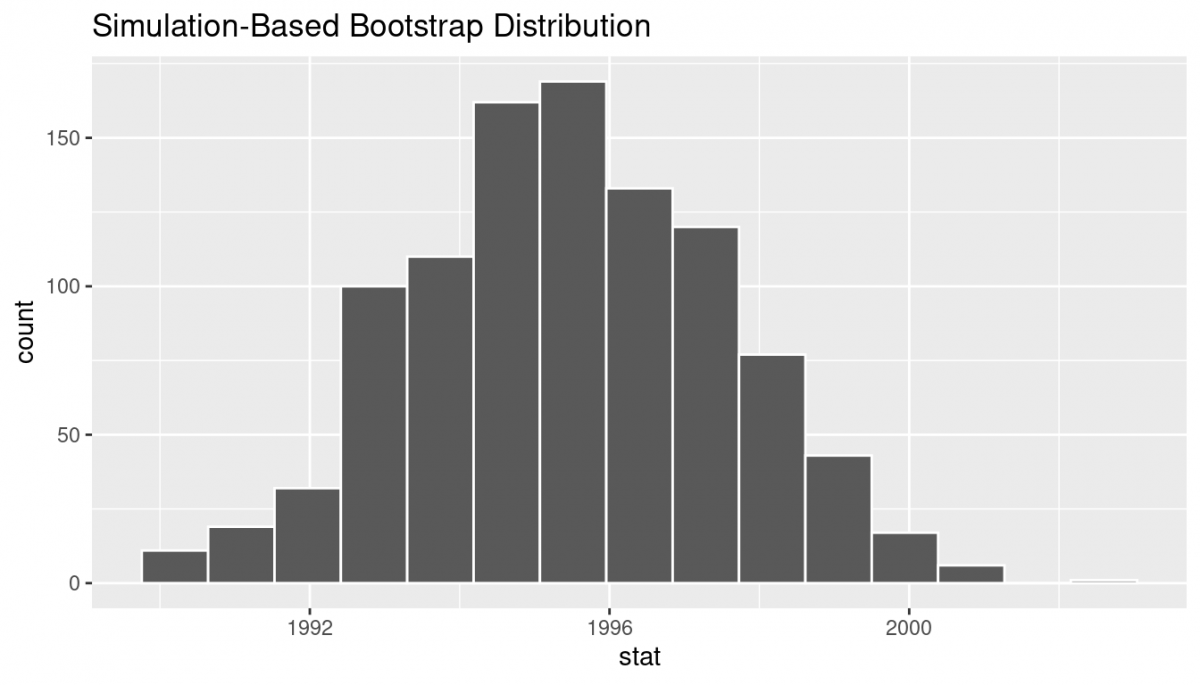
visualize() is a wrapper function for the ggplot() function that uses a geom_histogram() layer. That is, it's not just that this produces the same results for how we did this earlier—it's doing the exact same thing behind the scenes!
Calculating Confidence Intervals with the infer Package
Earlier, we introduced two different methods for constructing 95% confidence intervals for an unknown population parameter: the percentile method and the standard error method. Let’s now check out the infer package code that explicitly constructs these. There are also some additional neat functions to visualize the resulting confidence intervals built-in to the infer package!
Percentile Method with infer
Recall the percentile method for constructing 95% confidence intervals we introduced earlier. This method sets the lower endpoint of the confidence interval at the 2.5th percentile of the bootstrap distribution and similarly sets the upper endpoint at the 97.5th percentile. The resulting interval captures the middle 95% of the values of the sample mean in the bootstrap distribution.
We can compute the 95% confidence interval by piping bootstrap_distribution into the get_confidence_interval() function from the infer package, with the confidence level set to 0.95 and the confidence interval type to be "percentile". Let’s save the results in percentile_ci.
percentile_ci <- bootstrap_distribution %>%
  get_confidence_interval(level = 0.95, type = "percentile")
percentile_ci
# A tibble: 1 × 2
lower_ci upper_ci
1 1991.24 1999.42 Alternatively, we can visualize the interval (1991.24, 1999.42) by piping the bootstrap_distribution data frame into the visualize() function and adding a shade_confidence_interval() layer. We set the endpoints argument to be percentile_ci.
visualize(bootstrap_distribution) +
  shade_confidence_interval(endpoints = percentile_ci)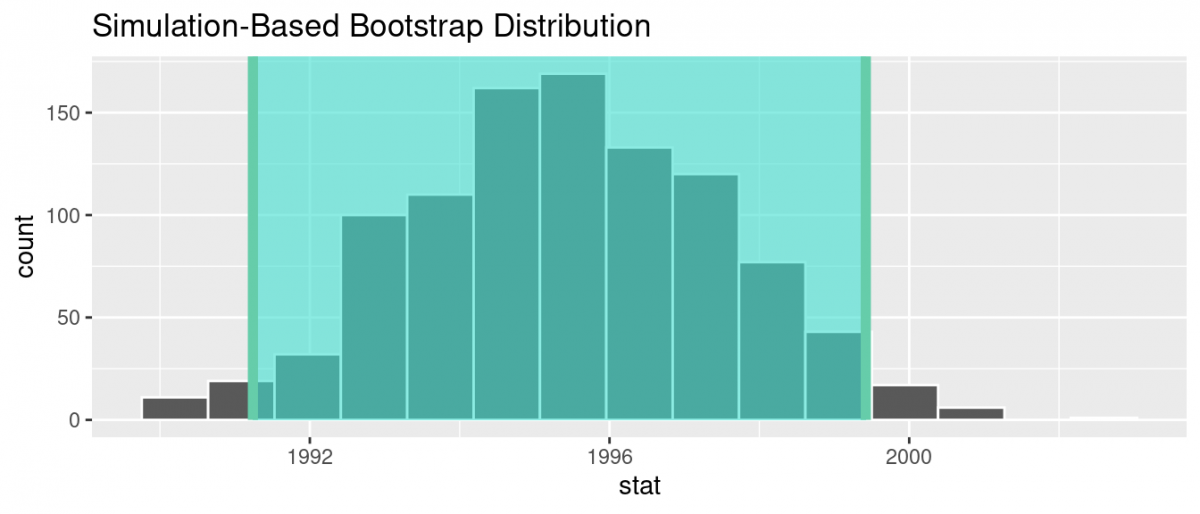
Observe that 95% of the sample means stored in the stat variable in bootstrap_distribution fall between the two endpoints marked with the darker lines, with 2.5% of the sample means to the left of the shaded area and 2.5% of the sample means to the right. You also have the option to change the colors of the shading using the color and fill arguments.
You can also use the shorter named function shade_ci() and the results will be the same. This is for folks who don’t want to type out all of confidence_interval and prefer to type out ci instead. Try out the following code!
visualize(bootstrap_distribution) +
  shade_ci(endpoints = percentile_ci, color = "hotpink", fill = "khaki")
Standard Error Method with infer
Recall the standard error method for constructing 95% confidence intervals we introduced earlier. For any distribution that is normally shaped, roughly 95% of the values lie within two standard deviations of the mean. In the case of the bootstrap distribution, the standard deviation has a special name: the standard error.
So, in our case, 95% of values of the bootstrap distribution wil lie within 1.96 standard errors of the sample mean. Computation of the 95% confidence interval can once again be done by piping the bootstrap_distribution data frame we created into the get_confidence_interval() function. However, this time we set the first type argument to be "se". Second, we must specify the point_estimate argument in order to set the center of the confidence interval. We set this to be the sample mean of the original sample of 50 pennies of 1995.44 we saved in pennies_mean earlier.
standard_error_ci <- bootstrap_distribution %>%
  get_confidence_interval(type = "se", point_estimate = pennies_mean)
> Using `level = 0.95` to compute confidence interval.
standard_error_ci# A tibble: 1 × 2
lower_ci upper_ci
1 1991.35 1999.53 If we would like to visualize the interval (1991.35, 1999.53), we can once again pipe the bootstrap_distribution data frame into the visualize() function and add a shade_confidence_interval() layer to our plot. We set the endpoints argument to be standard_error_ci.
visualize(bootstrap_distribution) +
  shade_confidence_interval(endpoints = standard_error_ci)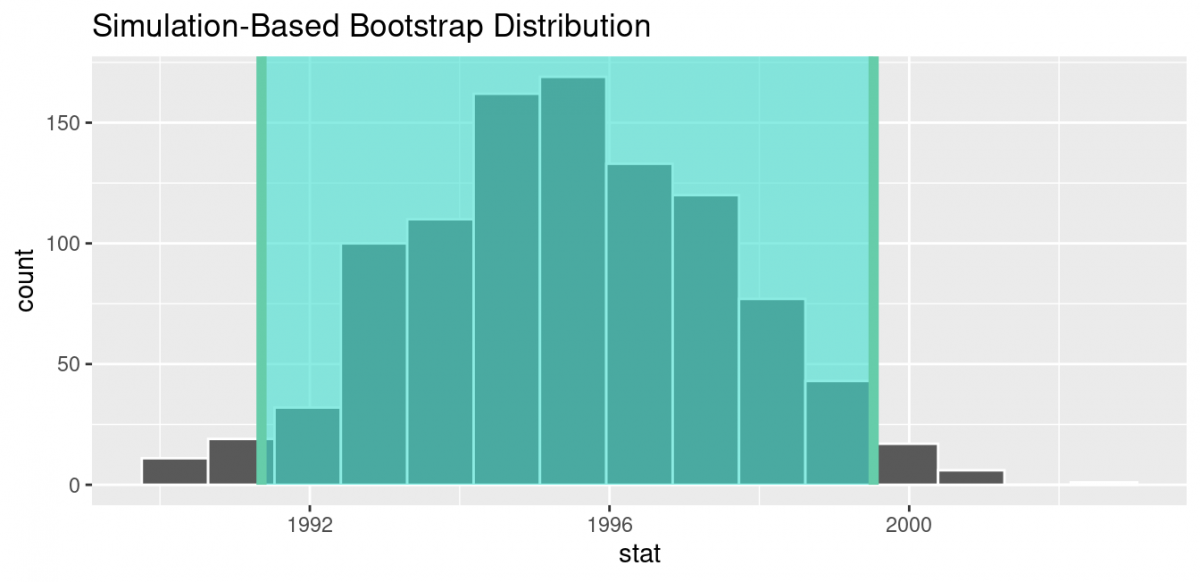
As we noted before, both methods produce similar confidence intervals!