Chapter 2: Collect and Apply Relevant Data

Scott shares this story about the benefits of collecting data: As a competitive high school and college shot putter, I knew exactly what a perfect throw looked like, and felt like, and I knew what to do to increase the distance of the throw. I analyzed hundreds of hours of video, studied the physics of gliding, spinning, and the angles of release for throwing. I understood the power position or the length of motion of the ball as it moves through the release zone. I kept data on every variable to determine what changes increased the distance of each throw. Small changes could result in significant improvement but most change came in small increments. If a change led to even a half-inch improvement, I recorded the cause of the benefit. I was small for a shot putter, by 50 lbs and several inches in height. I needed every advantage I could get.
Even though I would never compete at the Olympics, I was a fierce competitor. Every time I stepped in the ring, my goal was to beat my previous throw and improve my personal best. In competition, I always chose to throw first, to keep my focus on my performance and not be distracted by the performance of my competitors. In 1974, I broke my college record by five inches. The newspaper reported the throw as the 4th longest in the country that year at the college level. Two days later in my Sunday morning practice, I consistently threw two feet further than the record-breaking throw. It was as if the barrier in my mind had been broken, releasing new possibilities. This competitive focus for high achievement paired with my understanding of incremental improvement transferred into my teaching. I strategically used various types of data to improve student performance beyond what they thought possible expanding their vision of what is possible for their life.
See the Whole Picture
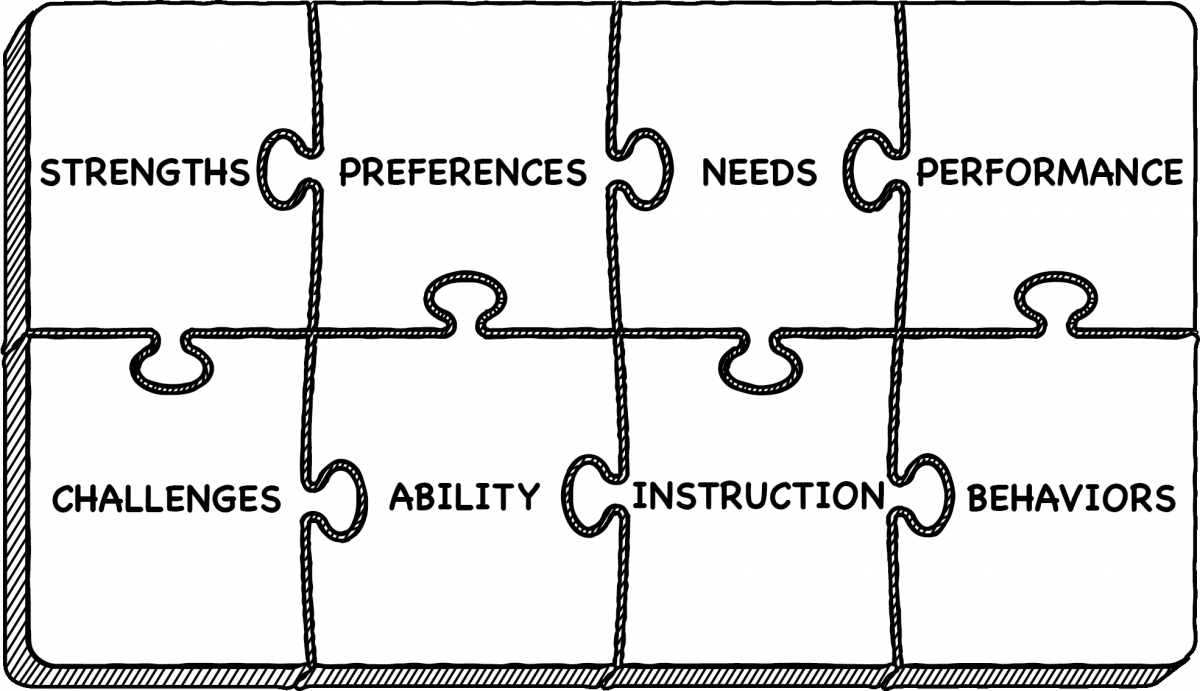
Collecting data is just the beginning. Applying the data to improve performance is part of the art of teaching. As with a single piece in a jigsaw puzzle, each piece of information cannot be interpreted in isolation. The collection of data points reveals a more complete picture which includes student ability, strengths, challenges, behaviors, and preferences to understand the connections between performance, instruction, and student needs. The meaning of each piece of data is revealed when it is appropriately connected to the whole picture. When teachers explore multiple data points simultaneously, a clearer view of the child and solutions for learning will emerge.

When teachers look at the whole picture influencing student performance, they can adapt for individual needs. For example, if a student tests with a high intellect but they are producing poor work, a teacher can explore why this is happening. Is it lack of motivation, lack of challenge, outside stress, a need for glasses, a hearing aid, or another factor? If student work exceeds the indicator of the formal assessment, a teacher can look for clues about why the student is not demonstrating competency on the test. For example, a different type of assessment can be tried to discover if the student struggles with the content or the assessment method. Additionally, the student may not be able to process some types of information and understand only fragments. Additional activities can develop their neurophysiology for interconnectivity between information and application. Activities where the students experience their strengths and joy can build interconnectivity between their passions and a difficult concept. Consider activities that the child is drawn to, such as drawing, playing an instrument, dancing, or sports, and provide ways to incorporate them regularly.
To help complete this whole picture of the child, teachers should keep a file on each student to collect a variety of artifacts. The file should include both formal assessment data and informal information as well as evidence of formative assessment. As data is collected, this file will hold many clues leading to answers to personalize instruction for each student. File artifacts could include:
- Testing data from previous years in school and all additional formal testing that has been done.
- Notes from previous teachers and other school personnel from previous years.
- Current academic data and benchmark results: reading level, vocabulary level, comprehension, fluency, math facts, spelling, other content area test and quiz data (kept in a grade book).
- Samples of student work.
- Personal information: strengths, challenges, likes, dislikes, personality, situational stress including information about family/home, etc. (see tracking sheet in Chapter 1).
- Developmental indicators for physical, cognitive, and social-emotional growth.
- Cards or drawings the students have given the teacher.
- Notes from home and from other school personnel.
- Self and peer assessments.
- Any other relevant information.
Teachers can record academic information in a traditional grade book. For parent teacher conferences, a copy of the individual student scores can be printed and placed in the file. Examples of student work should also be brought to conferences to celebrate and discuss with parents and students.
To monitor academic progress, schools and districts often establish a unified system for benchmark data to track student growth. Benchmark assessments can track reading level, reading fluency, math facts, vocabulary, content assessments, etc., which can inform daily instructional decisions as well as provide summative indicators of growth. The purpose and limitations of each assessment should be considered. Select complementary assessments and optimize instructional time by minimizing testing cycles prudently.
Scott reflects on the data dilemma: Many teachers talk about the stress in education of too much emphasis on testing and data collection, particularly when data is misused to categorize students and evaluate teachers instead of as a learning tool. I have seen time wasted with unnecessarily repeated testing cycles, as well as with misunderstood and inefficient use of data. I have seen teachers give up on what they know is effective to comply with “research based” mandates. I have seen students develop nervous tics, pulling their own hair or biting their own hand, leaving teeth marks, when required to take long exams on a computer. The cognitive dissonance I feel in those moments is demoralizing. On the other hand, equally painful are the times I have experienced when the opposite is true and there are no data collected or tests run to help students who need help. Or worse, the tests are run, and nothing changes in response to the data. I’ve seen early learning challenges left undiagnosed and essential intervention opportunities missed, causing students to get further behind and leaving life-long scars. If K-2 teachers are adequately trained in diagnostics and early intervention, and use the available data appropriately, help can be delivered during this critical developmental phase of life, protecting children and saving resources. The most humbling yet rewarding part of teaching first grade for 30 years was that I know my influence established a life-long trajectory. I believe that more needs to be done to help students in these early years and to address the needs of older students who did not get the needed help.
What students produce can be the most telling and valuable indicator of academic progress and ability. In project-based classrooms, students demonstrate knowledge and skills through the quality of the projects they create. Evaluating the work students create or perform is authentic assessment. Authentic assessment is formative as it informs instruction during the creation of the artifact/product in an immediate feedback loop. The artifact /product can also be a summative assessment as in a book report, a music concert, or a science fair project. Authentic assessment also reveals work and thinking habits such as determination, focus, collaboration, creativity, critical thinking, and problem-solving. The learning is visible in what students produce as well as in how they engage while they are working. The following questions will help teachers gather information about students while they are working:
- Do they stay on task?
- What questions do they ask?
- What connections do they make?
- How do they solve problems?
Test scores, leveled rankings, and other information gathered should align with the work being produced. When they don’t, teachers can explore possible causes of the discrepancy. What is the student missing? How can the gap be addressed? This is when the personal and behavioral data gathered earlier becomes essential to provide ideas to help students achieve at their fullest potential.
The more information a teacher uncovers about a student, the more precisely selected solutions can be applied to individual needs and strengths. Some data monitors student growth and other data informs instructional choices. Students benefit from creative teachers who look for various applications of data.
Another form of data comes in educational research, theories, and accepted principles. There are many effective research-based instructional practices available in reputable journals and books. To understand and apply the most relevant research effectively, educators can ask:
- How are my students/school/community the same or different from those in the research study?
- How does this research present strategies to optimize the strengths of our students/school/community as well as the greatest needs?
The more relevant research-based strategies a teacher collects, the more options the teacher will have to help the students. As with all scientific discovery, it is the creative application of information that reveals how practices, theories, and strategies are most effective to advance the field.
The whole student becomes visible as the data reveals various aspects of each individual and possible instructional strategies. Teachers who use formal and informal data well, and apply the relevant research, will develop effective practices through deliberate repeated trial and error, refining their judgement until it appears instinctual and intuitive, like a gift rather than a skill.
Scott recalls a student who benefited from the “whole student” approach: William started his 5th grade year quietly but after a few weeks in my class, I started to enjoy his quick wit and sense of humor. In conversations, he used satire and a good vocabulary. He drew cartoons with captions. However, his schoolwork and achievement on tests did not reflect his ability. We connected as sarcastic artists, and he engaged in schoolwork when we were drawing and mind mapping. As he learned to draw with increased detail, the captions and ideas in his cartoons also become more sophisticated. His ability to talk on his feet showed promise for performing for others so I encouraged him to learn scripts which motivated him to read. His love for history inspired more reading and his academics improved, reaching the top of the class within a few months. Once his motivation matched his intellect, he performed at his ability. At parent teacher conferences, I mentioned I thought he would be great at acting. His mom found him drama classes right away. He enjoyed acting through middle school, high school, and college, which is the last time I heard from him. He and his mom enthusiastically let me know his time in my class was pivotal for his success.
Reflection
- How do you feel about data, testing, and assessment?
- How can you improve instruction using data?
- What do you most want to know about your students’ learning?
- What is the most important type of student data you track? Why?
- How can you better organize the data you collect to use it more effectively?
Want to Know More?
Ten Mindframes for Visible Learning: Teaching for Success John Hattie and Klaus Zierer
Contact your district leaders for descriptions of each required test given to your students. Find out the purpose of the test and the limitations of the test. Apply the information accordingly.